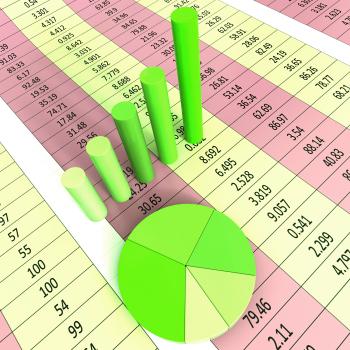
Africa Graph Indicates Financial Report And Analysis
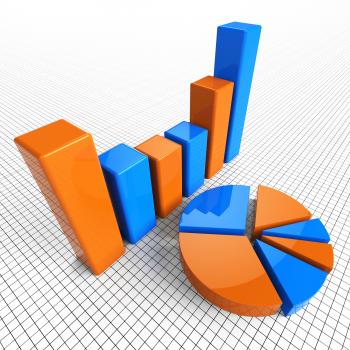
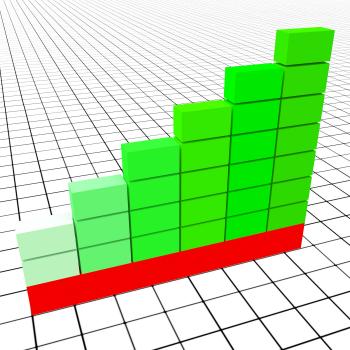
Graph Increasing Indicates Growth Statistics And Increase
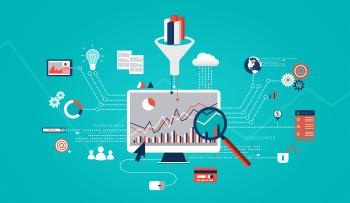
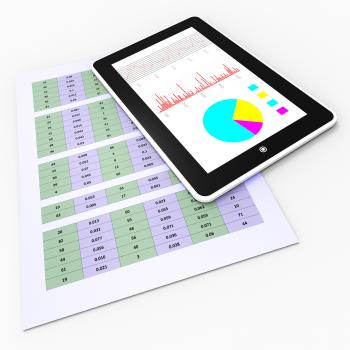
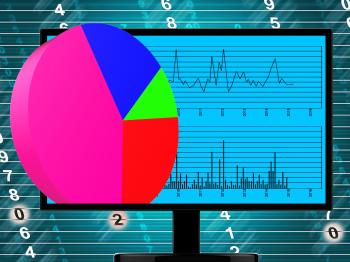
Online Report Represents World Wide Web And Computing
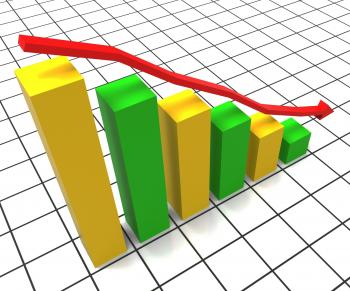
Decreasing Report Shows Graphic Analysis And Graphs
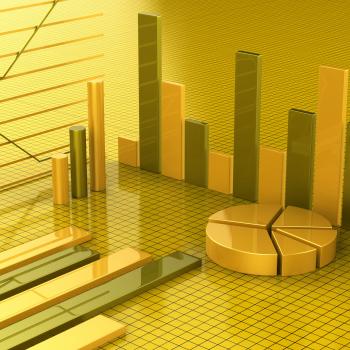
Graph Report Represents Trade Corporate And Finance
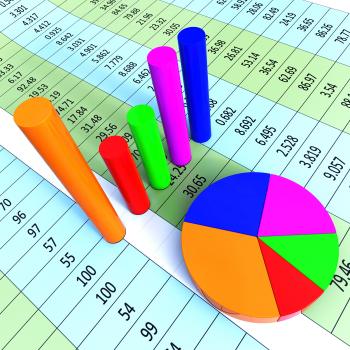
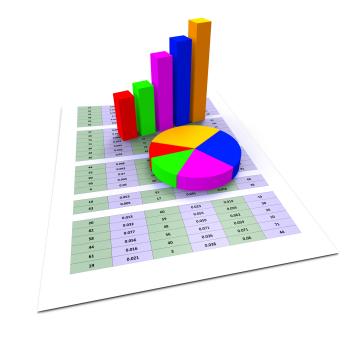
Business Report Shows Financial Infochart And Graphs
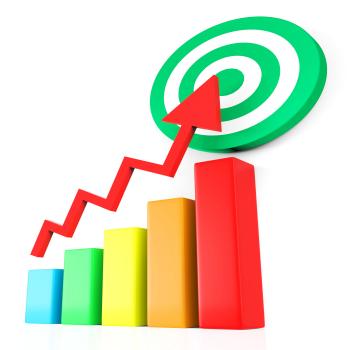
Target Report Represents Business Graph And Analysis
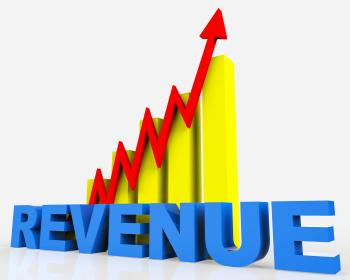
Increase Revenue Represents Business Graph And Advancing
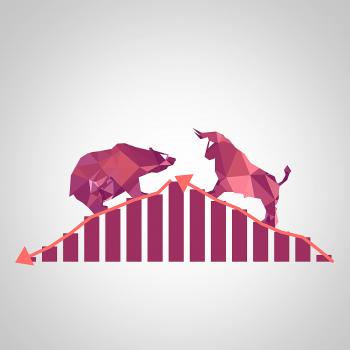
Bear Market - Markets are Falling
Equity markets - Bull versus Bear concept
Bull versus Bear
Improve Graph Indicates Improvement Plan And Data
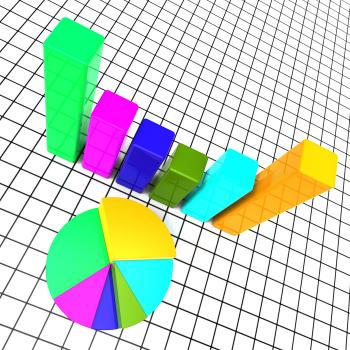
Pie Chart Report Means Data Reports And Graph
Networking Idea with Lightbulb
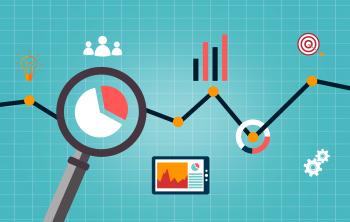
Online content marketing and web analytics concept
Web analytics concept with data icons
Web analytics concept - Multicolor version
Internet of Things concept - Tablet with Information Technology icons
Internet of Things concept - Laptop with Information Technology icons
Internet of Things - A connected world
Social media networks on the smartphone
Touchscreen smartphone with social media icons
Big Data Analytics
Knitted fabric texture
Jeans
Morning coffee and cookies
Morning coffee
Overhead view of coffee capsules
The Stock Market Game - Bulls and Bears
Cancer Graph Indicates Cancerous Growth And Diagram
Property Report Indicates Business Graph And House
Internet of Things concept - Globalized interconnected world
Internet of Things II - Multicolor version
Internet of Things concept - everything is connected in the new world
Concept of Search Engine Optimization with SEO icons
Concept of Search Engine Optimization
Internet of Things concept with digital cloud and devices
Graph Report Indicates Diagram Charts And Analysis
Social media marketing concept
Main social media brands - Illustration
Main social networks - Brands
Graph Report Shows Infograph Finance And Graphic
Analyzing a Pie Chart
The Internet of Things
Fashion Word Indicates Design Clothing And Elegance
Big Discount Indicates Cut Rate And Data
Prices Increase Represents Financial Report And Diagram
Pie Chart Report Represents Business Graph And Diagram
Pie Chart Report Indicates Business Graph And Document
Pie Chart Indicates Financial Report And Charts
Graph Report Shows Graphs Charts And Infochart
Marketing Trends Shows E-Marketing E-Commerce And Seo
Pie Chart Indicates Stat Graphics And Infochart
Profits Graph Shows Earn Investment And Diagram
Business Graph Indicates Diagram Infochart And Profit
Risk Graph Shows Infochart Beware And Risky
Graph Increasing Shows Financial Report And Advance
Electronic Sensor Background Means Eye Sensor Or Trendy Technology
Budget Graph Means Costing Expenditure And Statistic
Downturn Graph Represents Market Chart And Loss 3d Rendering
Graph Earn Represents Graphics Salaries And Income
Cash Flow Graph Represents Investment Earn And Wage
Red Arrow Blasting Through Barrier
Economy Graph Indicates Micro Economics And Charts
Forex Graph Means Foreign Currency And Exchange
Fashion Sale Shows Glamour Promo And Promotional
Improve Economy Shows Business Graph And Advance
Business Graph Means Infochart Diagram And Statistic
Success Graph Means Winner Resolution And Winning
Fashion Shopping Bag Shows Fashionable Trendy And Stylish
Pie Chart Shows Business Graph And Charting
Savings Increasing Indicates Financial Report And Advance
Report Graph Represents Infograph Diagram And Financial
Finance Professional - Broker - Financial Advisor
Finance Professional - Broker - Financial Advisor - Analyst
Graph Report Indicates Business Statistic And Diagram
Decreasing Report Represents Business Graph And Decrease
Online Reports Means Tablet Pc And Charting
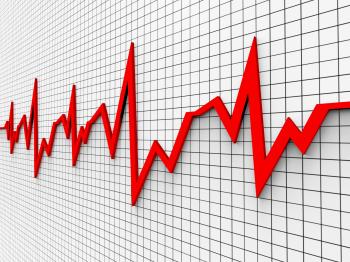
Heartbeat Chart Shows Flat Screen And Cardiograph
Statistics and Trends - Upward Trend - Abstract Image
Smartphones - Modern Communication Concept
Smartphones - Modern Communication Concept - Darker Version
Mobile Communications - Apps and Mobile Devices
Communication Using Apps - Modern Communication Concept
Increase Graph Represents Text Space And Copy
Pie Chart Online Represents Financial Report And Web
Commerce Graph Represents Ecommerce Trade And Forecast
Taxes Graph Means Duty Statistical And Infograph
Graph Audit Indicates Auditing Infograph And Scrutiny